2. Materials and Methods
2.1. Preparation of CD Solution
The concentration of the stock solution of 2-aminophenol (2AP) was 2 × 10⁻² mol/dm³. Aliquots of the stock solution (0.1 or 0.2 mL) were transferred into 10 mL volumetric flasks. Varying concentrations of α-CD or β-CD solutions (0.2, 0.4, 0.6, 0.8, and 1.0 × 10⁻² mol/dm³) were added. The mixed solutions were diluted to the mark with triply distilled water and shaken thoroughly. The final concentration of 2AP in all flasks was 4 × 10⁻⁴ mol/dm³. All experiments were carried out at room temperature (298 K).
2.2. Preparation of Ag: 2AP: CD Nanomaterials
A 0.01 M solution of silver nitrate was prepared in 50 mL of deionized water and warmed at 50-60°C for 30 minutes. Then, 1-2 mL of 1% trisodium citrate solution (1 g dissolved in 100 mL of deionized water) was added with vigorous stirring. The appearance of a pale yellow color confirmed the formation of silver nanoparticles
| [32] | A. Mani, P. Ramasamy, A. Antony Muthu Prabhu, N. Rajendiran, Investigation of Ag and Ag/Co bimetallic nanoparticles with naproxen-cyclodextrin inclusion complex. J. Molecular Structure, 1284 (2023) 135301-10.
https://doi.org/10.1016/j.molstruc.2023.135301 |
| [33] | A. Mani, G. Venkatesh, P. Senthilraja, N. Rajendiran, Synthesis and Characterisation of Ag-Co-Venlafaxine-Cyclodextrin Nanorods, European J Advanced Chemistry Research, 5 (2024) 9-16. https://doi.org/10.24018/ejchem.2024.5.1.147 |
| [34] | A. Mani, P. Ramasamy, A. Antony Muthu Prabhu, P. Senthilraja, N. Rajendiran, Synthesis and Analysis of Ag/Olanzapine /Cyclodextrin and Ag/Co/Olanzapine /Cyclodextrin Inclusion Complex Nanorods. Physics and Chemistry of Liquids, 62 (2024) 196-209.
https://doi.org/10.1080/00319104.2023.2297223 |
| [35] | A. Mani, P. Ramasamy, A. Antony Muthu Prabhu, P. Senthilraja, N. Rajendiran, Synthesis and Characterisation of Ag/Co/Chloroquine/Cyclodextrin Inclusion Complex Nanomaterials. J Sol-Gel Science and Technology 115 (2025) 844-856. https://doi.org/10.1007/s10971-024-06620-5 |
| [36] | N. Rajendiran, A. Mani, M. Venkatesan, B. Sneha, E. Nivetha, P. Senthilraja, Spectral, Microscopic, Antibacterial and Anticancer Activity of Pyrimethamine drug with Ag nano, DNA, RNA, BSA, Dendrimer, and Cyclodextrins, J Solution Chem, In press. https://doi.org/10.1007/s10953-025-01529-1 |
[32-36]
.
Cyclodextrin (1 mmol) was dissolved in 40 mL of distilled water, and 2AP (1 mmol) dissolved in 10 mL of ethanol was slowly added to the CD solution. The mixture was stirred at 50°C for 2 hours using a magnetic stirrer. Subsequently, the silver nanoparticle solution was added and stirred for an additional 2 hours. The resulting dilute solution was gently warmed at 40-50°C until its volume was reduced by approximately 50%. The solution was then refrigerated overnight at 5°C.
The precipitated Ag-2AP-CD nanomaterials were collected by filtration and washed several times with small amounts of ethanol and water to remove uncomplexed 2AP, silver, and CD, respectively. The product was dried under vacuum at room temperature and stored in an airtight container. The resulting powder samples were used for further characterization and analysis
| [32] | A. Mani, P. Ramasamy, A. Antony Muthu Prabhu, N. Rajendiran, Investigation of Ag and Ag/Co bimetallic nanoparticles with naproxen-cyclodextrin inclusion complex. J. Molecular Structure, 1284 (2023) 135301-10.
https://doi.org/10.1016/j.molstruc.2023.135301 |
| [33] | A. Mani, G. Venkatesh, P. Senthilraja, N. Rajendiran, Synthesis and Characterisation of Ag-Co-Venlafaxine-Cyclodextrin Nanorods, European J Advanced Chemistry Research, 5 (2024) 9-16. https://doi.org/10.24018/ejchem.2024.5.1.147 |
| [34] | A. Mani, P. Ramasamy, A. Antony Muthu Prabhu, P. Senthilraja, N. Rajendiran, Synthesis and Analysis of Ag/Olanzapine /Cyclodextrin and Ag/Co/Olanzapine /Cyclodextrin Inclusion Complex Nanorods. Physics and Chemistry of Liquids, 62 (2024) 196-209.
https://doi.org/10.1080/00319104.2023.2297223 |
| [35] | A. Mani, P. Ramasamy, A. Antony Muthu Prabhu, P. Senthilraja, N. Rajendiran, Synthesis and Characterisation of Ag/Co/Chloroquine/Cyclodextrin Inclusion Complex Nanomaterials. J Sol-Gel Science and Technology 115 (2025) 844-856. https://doi.org/10.1007/s10971-024-06620-5 |
| [36] | N. Rajendiran, A. Mani, M. Venkatesan, B. Sneha, E. Nivetha, P. Senthilraja, Spectral, Microscopic, Antibacterial and Anticancer Activity of Pyrimethamine drug with Ag nano, DNA, RNA, BSA, Dendrimer, and Cyclodextrins, J Solution Chem, In press. https://doi.org/10.1007/s10953-025-01529-1 |
[32-36]
.
2.3. Instruments Used
Absorption spectra were recorded using Shimadzu UV-Visible spectrophotometers (Models 1650 PC and UV-2600 PC), while fluorescence measurements were carried out on a Shimadzu RF-5301 fluorimeter.
FTIR: Using an Avatar FTIR spectrometer, FTIR analysis was conducted, which is a typical method for determining molecular structures and detecting functional groups. Pellets were formed by combining 4 mg of sample with 120 mg of KBr. A resolution of 4 cm-1 (256 scans) was used to capture spectra spanning the 4000-400 cm-1 range.
DTA: An analysis of the nanomaterials' and components' thermal behaviour was conducted using STRe software and a Mettler Toledo DSC1 equipment. Under a nitrogen environment, samples ranging from 2 to 5 mg were scanned at a temperature of 10°C/min from 25 to 280°C in pans made of aluminium. The instrument was calibrated with indium.
XRD: XRD patterns were recorded using a BRUKER D8 Advance diffractometer (Bruker AXS GmbH, Karlsruhe, Germany) equipped with Cu Kα₁ radiation (λ = 1.5406 Å), operated at 40 kV and 20 mA. The diffraction data were collected over a 2θ range of 5°-80°, with a scan rate of 5°/min and a step size of 0.03°, using dry powdered samples.
FE-SEM: Imaging surface morphology and microstructure using a scanning electron microscope (SEM) is a multipurpose approach. The SEM scans the surface of a solid sample using a concentrated stream of high-energy electrons, and the signals it emits reveal the material's topography, composition, crystallinity, and electrical characteristics. An XL ESEM machine was used to obtain SEM pictures for this investigation. The samples that had been pulverised were attached to brass stubs using conductive tape that had two sides. A vacuum sputter coater was used for 30 seconds at 30 W to coat the samples with a thin conductive coating (carbon, gold, silver, or platinum) that was around 200 thick before imaging. The conductivity, resolution, and prevention of charge buildup are all improved by this coating. With an excitation voltage of either 15 or 25 kV, imaging was carried out at magnifications of 200×, 500×, and 5000×.
Molecular Modeling Studies: PM3 semiempirical approach was used to study the inclusion behaviour of the compounds containing α-CD and β-CD because it is computationally efficient and can efficiently represent complex molecular systems, particularly those with non-covalent interactions like hydrogen bonding. Spartan 08 was used to build the guest molecules' and CDs' initial geometries, and then we optimised them using the PM3 technique in the Gaussian 09W package. While optimising, no symmetry restrictions were enforced.
3. Result and Discussion
3.1. Effect of α-CD and β-CD with pH on 2-aminophenol
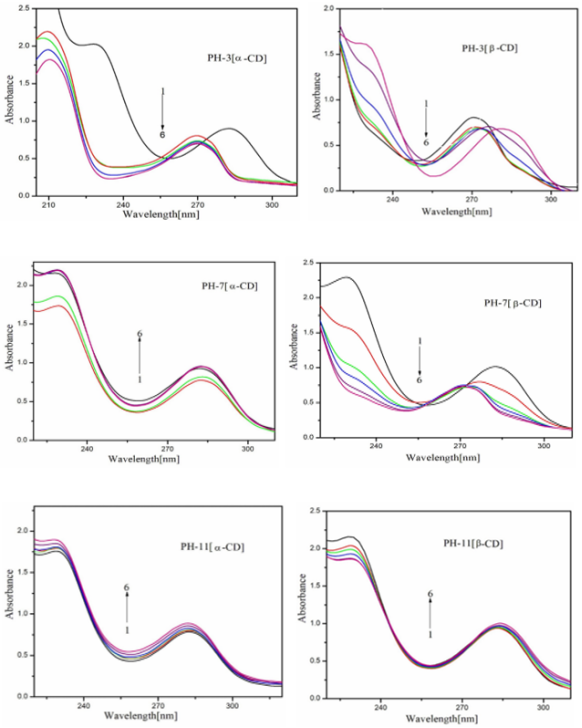
To analyze the inclusion behavior of the monocationic, neutral, and monoanionic forms of 2AP with α-CD and β-CD, the absorption and emission spectra (
Table 1,
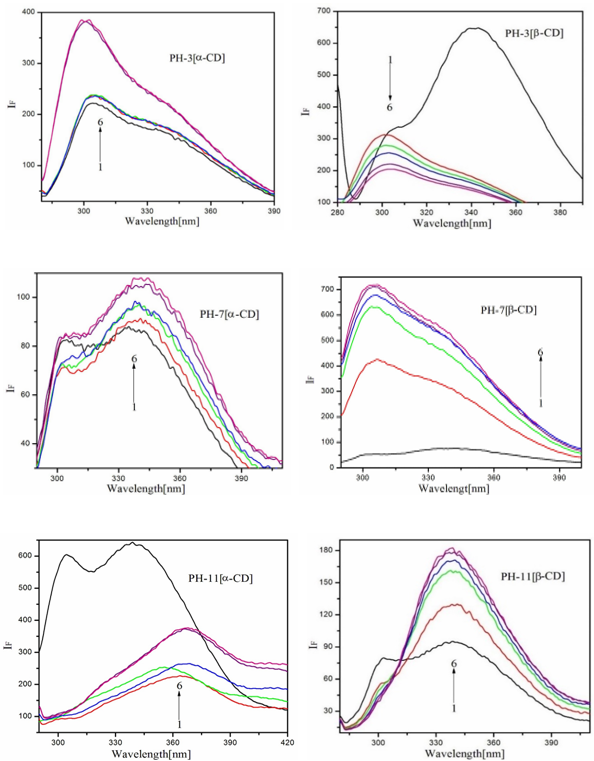
Figure 1, and
Figure 2) were recorded in solutions of approximately pH~3, pH~7, and pH~11. The absorption and emission maxima of 2AP in these pH conditions (in the absence of CD) appear at the following wavelengths: pH ~3: λ
abs = 272, 212 nm; λ
flu = 300 nm; pH ~7: λ
abs = 283, 232 nm; λ
flu = 337 nm; pH ~11: λ
abs = 286, 216 nm; λ
flu = 338 nm. These results indicate that the monocationic species is predominant at pH ~3, the neutral species at pH ~7, and the monoanionic species at pH ~11. At pH ~7, the emission maximum at 337 nm resembles that observed in non-aqueous solvents and can therefore be assigned to the molecular form of 2AP.
The spectral maxima of 2AP in selected solvents are as follows: cyclohexane: λ
abs= 286, 236 nm; λ
flu = 320 nm; acetonitrile: λ
abs= 289, 240 nm; λ
flu = 326 nm; methanol: λ
abs= 284, 235 nm; λ
flu = 330 nm; water: λ
abs= 282, 229 nm; λ
flu = 335 nm. These results show that in different solvents, the absorption and emission maxima of 2AP are similar to those of 2-anisidine (2AS)
: cyclohexane: λ
abs= 285, 235 nm; λ
flu = 309 nm; acetonitrile: λ
abs= 288, 240 nm; λ
flu = 323 nm; methanol: λ
abs= 286, 237 nm; λ
flu = 327 nm; water: λ
flu = 284, 230 nm; λ
flu = 334 nm. 2AP exhibits a single broad emission band in all solvents. The absence of longer-wavelength emission indicates that intramolecular charge transfer (ICT), exciplex, or excimer formation does not occur in any of the solvents
| [17] | R. K. Sankaranarayanan, A. Antony Muthu Prabhu, N. Rajendiran, Inclusion complexation of 3, 5-dihydroxy benzoic acid with β-CD at different pH. Indian J. Chemistry, 48A (2009)1515-1521. |
| [18] | R. K. Sankaranarayanan, A. Antony Muthu Prabhu, N. Rajendiran, A Study on the inclusion complexation of 3, 4, 5-trihydroxybenzoic acid with β-CD at different pH. J. Inclusion Phenomena and Macrocyclic Chemistry, 67(2010)461-470,
https://doi.org/10.1007/s10847-010-9769-3 |
| [19] | T. Stalin, P. Vasantharani, B. Shanthi, A. Sekar, N. Rajendiran, Inclusion complex of 1, 2, 3-trihydroxybenzene with α- and β-cyclodextrins. Indian J Chemistry, 45A (2006) 1113-1120. |
| [20] | A. Antony Muthu Prabhu, V. K. Subramanian, N. Rajendiran, Excimer formation in inclusion complexes of β-CD with salbutamol, sotalol and atenolol: Spectral and molecular modeling studies, Spectrochimica Acta, 96A (2012) 95-107.
https://doi.org/10.1016/j.saa.2012.06.005 |
| [21] | M. Jude Jenita, G. Venkatesh, V. K. Subramanian, N. Rajendiran, Excimer formation in inclusion complexes of antihypertensive drugs with HP-α- and HP-β-CDs, Indian J. Chemistry, 52A (2013) 207-216. |
[17-21]
.
When compared with aniline (cyclohexane: λ
flu = 283, 235 nm; λ
flu = 320 nm; acetonitrile: λ
flu = 286, 238 nm; λ
flu = 329 nm; methanol: λ
flu = 284, 232 nm; λ
flu = 334 nm; water: λ
flu = 278, 230 nm; λ
flu = 335 nm)
| [37] | R. S. Sarpal, S. K. Dogra, Prototropism in aminophenols and anisidines: A reinvestigation. J. Photochem. 38 (1987) 263-276. https://doi.org/10.1016/0047-2670(87)85031-5 |
| [38] | N. Rajendiran, M. Swaminathan, Luminescence characteristics of 4, 4′-diaminodiphenyl methane in different solvents and at various pH. Spectrochim. Acta A 52 (1996) 1785-1792.
https://doi.org/10.1016/0584-8539(96)01741-9 |
| [39] | T. Stalin, R. Anithadevi, N. Rajendiran, Spectral characteristics of ortho, meta and para dihydroxybenzenes in different solvents, pH and β-cyclodextrin. Spectrochim. Acta A 61 (2005) 2495-2504. https://doi.org/10.1016/j.saa.2004.08.024 |
[37-39]
, no significant spectral changes are observed for 2AP. However, relative to phenol (cyclohexane: λ
flu = 277-271 nm; λ
flu = 300 nm; acetonitrile: λ
flu = 278-272 nm; λ
flu = 302 nm; methanol: λ
flu = 275-272 nm; λ
flu = 305 nm; water: λ
flu = 272-278 nm; λ
flu = 305 nm)
| [37] | R. S. Sarpal, S. K. Dogra, Prototropism in aminophenols and anisidines: A reinvestigation. J. Photochem. 38 (1987) 263-276. https://doi.org/10.1016/0047-2670(87)85031-5 |
| [38] | N. Rajendiran, M. Swaminathan, Luminescence characteristics of 4, 4′-diaminodiphenyl methane in different solvents and at various pH. Spectrochim. Acta A 52 (1996) 1785-1792.
https://doi.org/10.1016/0584-8539(96)01741-9 |
| [39] | T. Stalin, R. Anithadevi, N. Rajendiran, Spectral characteristics of ortho, meta and para dihydroxybenzenes in different solvents, pH and β-cyclodextrin. Spectrochim. Acta A 61 (2005) 2495-2504. https://doi.org/10.1016/j.saa.2004.08.024 |
[37-39]
, a red shift is observed for 2AP, indicating delocalization between the amino and hydroxyl groups.
Table 1. Absorption and fluorescence maxima of 2-aminophenol (2AP) with different α-CD and β-CD concentrations.
Concentration of α-CD x10-3 M | pH - 3.0 | pH - 7 | pH - 11 |
abs | flu | IF | abs | flu | IF | abs | flu | IF |
2AP only (without CD) | 281 228 | 303 | 0.32 | 283 229 | 302 341 | 0.34 | 284 230 | 338 | 0.29 |
0.2 M α-CD | 269 211 | 303 | 0.41 | 281 229 | 302 341 | 0.40 | 284 230 | 363 | 0.36 |
1.0 M α-CD | 269 211 | 303 | 0.53 | 281 229 | 302 341 | 0.49 | 284 230 | 365 | 0.51 |
0.2 M β-CD | 270 209 | 301 | 0.43 | 277 229 | 303 | 0.46 | 283 228 | 337 300 | 0.48 |
1.0 M β-CD | 270 210 | 302 | 0.56 | 273 229 | 303 | 0.57 | 283 228 | 337 300 | 0.61 |
K (1: 1) x105 M-1 α-CD | 60 | 114 | | 500 | 201 | | 55 | 314 | |
G (kcalmol-1) α-CD | -10.32 | -22.35 | | -9.53 | -40 | | -15 | -22.0 | |
K (1: 1) x105 M-1 β-CD | 86.3 | 85 | | 70.7 | 213 | | 220 | 195 | |
G (kcalmol-1) β-CD | 11.2 | -13 | | -10.7 | -10.0 | | -18.6 | -15.0 | |
Excitation wavelength (nm) | | 270 | | | 270 | | | 270 | |
In solvents, the absorption maximum of 2AP is red-shifted from cyclohexane to acetonitrile but blue-shifted in alcohol and water, whereas the emission maximum is progressively red-shifted from cyclohexane to water. 2AP exhibits a single broad fluorescence band in all solvents, and the absence of longer-wavelength emission in polar solvents further confirms the absence of excimer or exciplex formation. In all solvents, 2AP displays a single emission band, whereas in CD solutions dual emission is observed. The dual emission can be explained as follows: one band appears in the shorter-wavelength region (300 nm, SW) and the other in the longer-wavelength region (360 nm, LW). As the CD concentration increases, both SW and LW emission bands undergo red shifts, with the LW band showing a larger shift.
Figure 1. Absorbance spectra of PTD in different α-CD and β-CD concentrations (M): 0, (2) 0.002, (3) 0.004, (4) 0.006, (5) 0.008, (6) 0.01.
Figure 2. Fluorescence spectra of PTD in different α-CD and β-CD concentrations (M): 0, (2) 0.002, (3) 0.004, (4) 0.006, (5) 0.008, (6) 0.01.
In both α-CD and β-CD solutions, the absorption and emission maxima, as well as the spectral profiles of 2AP at pH~3, pH~7, and pH~11, differ from one another. In α-CD, the absorption maximum is blue-shifted at pH ~3 and shows no significant change at pH~7 and pH ~11. In β-CD, the absorption is red-shifted at pH~3, blue-shifted at pH~7, and shows no notable shift at pH~11. In α-CD, the absorbance of 2AP decreases at pH ~3 but increases at pH ~7 and pH ~11. In β-CD, the absorbance decreases at pH~3 and pH ~7 but increases at pH ~11.
In the excited state, in α-CD solutions, the emission intensity increases in all three pH values, whereas in β-CD the emission intensity decreases at pH ~3 but increases at pH~7 and pH~11 (
Figure 2). In all the pH conditions, dual emission bands are observed in both CDs. In aqueous CD-free solutions, the emission maxima at pH~3, pH~7, and pH~11 differ from each other. In α-CD at pH~3, 2AP shows an emission maximum at 300 nm, while at pH~7 and pH~11, it appears at 337 nm. Increasing α-CD concentration enhances the single emission intensity at pH ~3 and induces dual emission at pH~7 and pH~11. The effect of β-CD on the emission spectra of 2AP differs from that of α-CD. With increasing β-CD concentration, emission intensity decreases at pH~3 but increases at pH~7 and pH~11. In β-CD, a single emission band is observed at pH~3 and pH~7, while dual emission appears at pH~11. Further, at pH~11, the intensity of the shorter-wavelength band (SW, normal emission) decreases, whereas the longer-wavelength (LW) emission increases
| [17] | R. K. Sankaranarayanan, A. Antony Muthu Prabhu, N. Rajendiran, Inclusion complexation of 3, 5-dihydroxy benzoic acid with β-CD at different pH. Indian J. Chemistry, 48A (2009)1515-1521. |
| [18] | R. K. Sankaranarayanan, A. Antony Muthu Prabhu, N. Rajendiran, A Study on the inclusion complexation of 3, 4, 5-trihydroxybenzoic acid with β-CD at different pH. J. Inclusion Phenomena and Macrocyclic Chemistry, 67(2010)461-470,
https://doi.org/10.1007/s10847-010-9769-3 |
| [19] | T. Stalin, P. Vasantharani, B. Shanthi, A. Sekar, N. Rajendiran, Inclusion complex of 1, 2, 3-trihydroxybenzene with α- and β-cyclodextrins. Indian J Chemistry, 45A (2006) 1113-1120. |
| [20] | A. Antony Muthu Prabhu, V. K. Subramanian, N. Rajendiran, Excimer formation in inclusion complexes of β-CD with salbutamol, sotalol and atenolol: Spectral and molecular modeling studies, Spectrochimica Acta, 96A (2012) 95-107.
https://doi.org/10.1016/j.saa.2012.06.005 |
| [21] | M. Jude Jenita, G. Venkatesh, V. K. Subramanian, N. Rajendiran, Excimer formation in inclusion complexes of antihypertensive drugs with HP-α- and HP-β-CDs, Indian J. Chemistry, 52A (2013) 207-216. |
[17-21]
.
The observed variations in absorbance, emission intensity, and spectral maxima arise from the encapsulation of 2AP molecules within the α-CD and β-CD cavities. No significant change in absorbance was observed even after 12 hours, indicating the stability of the inclusion complexes. The presence of an isosbestic point in the absorption spectra at all pH values suggests the formation of 1: 1 inclusion complexes, though the orientation of the guest molecule inside the CD cavity may differ
| [17] | R. K. Sankaranarayanan, A. Antony Muthu Prabhu, N. Rajendiran, Inclusion complexation of 3, 5-dihydroxy benzoic acid with β-CD at different pH. Indian J. Chemistry, 48A (2009)1515-1521. |
| [18] | R. K. Sankaranarayanan, A. Antony Muthu Prabhu, N. Rajendiran, A Study on the inclusion complexation of 3, 4, 5-trihydroxybenzoic acid with β-CD at different pH. J. Inclusion Phenomena and Macrocyclic Chemistry, 67(2010)461-470,
https://doi.org/10.1007/s10847-010-9769-3 |
| [19] | T. Stalin, P. Vasantharani, B. Shanthi, A. Sekar, N. Rajendiran, Inclusion complex of 1, 2, 3-trihydroxybenzene with α- and β-cyclodextrins. Indian J Chemistry, 45A (2006) 1113-1120. |
| [20] | A. Antony Muthu Prabhu, V. K. Subramanian, N. Rajendiran, Excimer formation in inclusion complexes of β-CD with salbutamol, sotalol and atenolol: Spectral and molecular modeling studies, Spectrochimica Acta, 96A (2012) 95-107.
https://doi.org/10.1016/j.saa.2012.06.005 |
| [21] | M. Jude Jenita, G. Venkatesh, V. K. Subramanian, N. Rajendiran, Excimer formation in inclusion complexes of antihypertensive drugs with HP-α- and HP-β-CDs, Indian J. Chemistry, 52A (2013) 207-216. |
| [22] | J. Prema Kumari, A. Antony Muthu Prabhu, G. Venkatesh, V. K. Subramanian, N. Rajendiran, Spectral characteristics of sulfadiazine, sulfisomidine: Effect of solvents, pH and β-CD. Physics and Chemistry of Liquids, 49(2011)108-132.
https://doi.org/10.1080/00319104.2010.527399 |
| [23] | N. Rajendiran, R. K. Sankaranarayanan, J. Saravanan, A study of supramolecular host-guest interaction of dothiepin and doxepin drugs with cyclodextrin macrocycles. J Molecular Structure, 1067(2014) 252-260. https://doi.org/10.1016/j.molstruc.2014.04.033 |
| [24] | A. Antony Muthu Prabhu, N. Rajendiran, Encapsulation of labetalol, and pseudoephedrine in β-CD cavity: Spectral and molecular modeling studies. J. Fluorescence, 22(2012)1461-1474. https://doi.org/10.1007/s10895-012-1100-2 |
| [25] | M. Jude Jenita, G. Venkatesh, V. K. Subramanian, N. Rajendiran, Twisted Intramolecular Charge Transfer effects on fast violet B and fast blue RR: Effect of HP-α-CD and HP-β-CDs. J. Molecular Liquids, 178 (2013) 160-167.
https://doi.org/10.1016/j.molliq.2012.11.033 |
| [26] | N. Rajendiran, M. Swaminathan, Photophysical behaviour of 4, 4-dihydroxydiphenyl sulphone Indian J. Chemistry, 35A (1996) 385-389. http://nopr.niscpr.res.in/handle/123456789/41347 |
| [27] | N. Rajendiran, R. K. Sankaranarayanan, J. Saravanan, Nanochain and vesicles formed by inclusion complexation of 4, 4’-diamino benzanilide with Cyclodextrins. J. Experimental Nanoscience, 10(2015)880-899.
https://doi.org/10.1080/17458080.2014.930523 |
| [28] | N. Rajendiran, R. K. Sankaranarayanan, J. Saravanan, Nanostructures formed by cyclodextrin covered amino benzophenones through supramolecular self assembly, Spectrochim Acta, 127A (2014) 52-60.
https://doi.org/10.1016/j.saa.2014.02.024 |
| [29] | G. Venkatesh, J. Thulasidhasan, N. Rajendiran, A spectroscopic and molecular modeling studies of the inclusion complexes of orciprenaline and terbutaline drugs with native and modified cyclodextrins. J. Inclusion Phenomena and Macrocyclic Chemistry, 78(2014)225-237.
https://doi.org/10.1007/s10847-013-0291-4 |
| [30] | N. Rajendiran, G. Venkatesh, Inclusion complexation of 4, 4'-dihydroxy benzophenone and 4-hydroxy benzophenone with α- and β-CD. Supramolecular Chemistry, 26(2014) 783-795.
https://doi.org/10.1080/10610278.2013.873125 |
[17-30]
. The binding constant (K,
Table 1) values were obtained from the slope and intercept of the Benesi-Hildebrand plots. The negative ΔG values (
Table 1) indicate that the inclusion process is spontaneous and exothermic at 303 K.
In the excited state, as the concentration of α-CD and β-CD increases, the emission intensity of 2AP either increases or decreases depending on the pH. In CD-free solutions, 2AP exhibits a single broad emission band, whereas upon addition of CD, a longer-wavelength emission band appears. In the excited state, the amino and hydroxyl groups become more conjugated with the aromatic π-system, resulting in a marked charge separation within the molecule. The large Stokes shift and broad emission suggest the presence of intramolecular proton transfer (IPT) between the amino and hydroxyl groups
| [17] | R. K. Sankaranarayanan, A. Antony Muthu Prabhu, N. Rajendiran, Inclusion complexation of 3, 5-dihydroxy benzoic acid with β-CD at different pH. Indian J. Chemistry, 48A (2009)1515-1521. |
| [18] | R. K. Sankaranarayanan, A. Antony Muthu Prabhu, N. Rajendiran, A Study on the inclusion complexation of 3, 4, 5-trihydroxybenzoic acid with β-CD at different pH. J. Inclusion Phenomena and Macrocyclic Chemistry, 67(2010)461-470,
https://doi.org/10.1007/s10847-010-9769-3 |
| [19] | T. Stalin, P. Vasantharani, B. Shanthi, A. Sekar, N. Rajendiran, Inclusion complex of 1, 2, 3-trihydroxybenzene with α- and β-cyclodextrins. Indian J Chemistry, 45A (2006) 1113-1120. |
| [20] | A. Antony Muthu Prabhu, V. K. Subramanian, N. Rajendiran, Excimer formation in inclusion complexes of β-CD with salbutamol, sotalol and atenolol: Spectral and molecular modeling studies, Spectrochimica Acta, 96A (2012) 95-107.
https://doi.org/10.1016/j.saa.2012.06.005 |
| [21] | M. Jude Jenita, G. Venkatesh, V. K. Subramanian, N. Rajendiran, Excimer formation in inclusion complexes of antihypertensive drugs with HP-α- and HP-β-CDs, Indian J. Chemistry, 52A (2013) 207-216. |
[17-21]
.
Among the neutral, monocationic, and monoanionic species, CDs preferentially include the neutral form due to the hydrophobic nature of their cavities
| [17] | R. K. Sankaranarayanan, A. Antony Muthu Prabhu, N. Rajendiran, Inclusion complexation of 3, 5-dihydroxy benzoic acid with β-CD at different pH. Indian J. Chemistry, 48A (2009)1515-1521. |
| [18] | R. K. Sankaranarayanan, A. Antony Muthu Prabhu, N. Rajendiran, A Study on the inclusion complexation of 3, 4, 5-trihydroxybenzoic acid with β-CD at different pH. J. Inclusion Phenomena and Macrocyclic Chemistry, 67(2010)461-470,
https://doi.org/10.1007/s10847-010-9769-3 |
| [19] | T. Stalin, P. Vasantharani, B. Shanthi, A. Sekar, N. Rajendiran, Inclusion complex of 1, 2, 3-trihydroxybenzene with α- and β-cyclodextrins. Indian J Chemistry, 45A (2006) 1113-1120. |
| [20] | A. Antony Muthu Prabhu, V. K. Subramanian, N. Rajendiran, Excimer formation in inclusion complexes of β-CD with salbutamol, sotalol and atenolol: Spectral and molecular modeling studies, Spectrochimica Acta, 96A (2012) 95-107.
https://doi.org/10.1016/j.saa.2012.06.005 |
| [21] | M. Jude Jenita, G. Venkatesh, V. K. Subramanian, N. Rajendiran, Excimer formation in inclusion complexes of antihypertensive drugs with HP-α- and HP-β-CDs, Indian J. Chemistry, 52A (2013) 207-216. |
| [22] | J. Prema Kumari, A. Antony Muthu Prabhu, G. Venkatesh, V. K. Subramanian, N. Rajendiran, Spectral characteristics of sulfadiazine, sulfisomidine: Effect of solvents, pH and β-CD. Physics and Chemistry of Liquids, 49(2011)108-132.
https://doi.org/10.1080/00319104.2010.527399 |
| [23] | N. Rajendiran, R. K. Sankaranarayanan, J. Saravanan, A study of supramolecular host-guest interaction of dothiepin and doxepin drugs with cyclodextrin macrocycles. J Molecular Structure, 1067(2014) 252-260. https://doi.org/10.1016/j.molstruc.2014.04.033 |
| [24] | A. Antony Muthu Prabhu, N. Rajendiran, Encapsulation of labetalol, and pseudoephedrine in β-CD cavity: Spectral and molecular modeling studies. J. Fluorescence, 22(2012)1461-1474. https://doi.org/10.1007/s10895-012-1100-2 |
| [25] | M. Jude Jenita, G. Venkatesh, V. K. Subramanian, N. Rajendiran, Twisted Intramolecular Charge Transfer effects on fast violet B and fast blue RR: Effect of HP-α-CD and HP-β-CDs. J. Molecular Liquids, 178 (2013) 160-167.
https://doi.org/10.1016/j.molliq.2012.11.033 |
| [26] | N. Rajendiran, M. Swaminathan, Photophysical behaviour of 4, 4-dihydroxydiphenyl sulphone Indian J. Chemistry, 35A (1996) 385-389. http://nopr.niscpr.res.in/handle/123456789/41347 |
| [27] | N. Rajendiran, R. K. Sankaranarayanan, J. Saravanan, Nanochain and vesicles formed by inclusion complexation of 4, 4’-diamino benzanilide with Cyclodextrins. J. Experimental Nanoscience, 10(2015)880-899.
https://doi.org/10.1080/17458080.2014.930523 |
| [28] | N. Rajendiran, R. K. Sankaranarayanan, J. Saravanan, Nanostructures formed by cyclodextrin covered amino benzophenones through supramolecular self assembly, Spectrochim Acta, 127A (2014) 52-60.
https://doi.org/10.1016/j.saa.2014.02.024 |
| [29] | G. Venkatesh, J. Thulasidhasan, N. Rajendiran, A spectroscopic and molecular modeling studies of the inclusion complexes of orciprenaline and terbutaline drugs with native and modified cyclodextrins. J. Inclusion Phenomena and Macrocyclic Chemistry, 78(2014)225-237.
https://doi.org/10.1007/s10847-013-0291-4 |
| [30] | N. Rajendiran, G. Venkatesh, Inclusion complexation of 4, 4'-dihydroxy benzophenone and 4-hydroxy benzophenone with α- and β-CD. Supramolecular Chemistry, 26(2014) 783-795.
https://doi.org/10.1080/10610278.2013.873125 |
[17-30]
. The red or blue shifts observed in the ground state in CD/pH solutions further indicate IPT involvement. Because the inclusion of 2AP depends on both the CD cavity size and pH, the absorption and emission spectra vary with pH and CD type. The spectral changes observed with CD addition at different pH values suggest that IPT interactions play a major role in the inclusion complexation. At higher α-CD and β-CD concentrations, differences in emission maxima and spectral profiles of 2AP at pH ~3, pH ~7, and pH ~11 confirm the formation of distinct inclusion complexes
| [17] | R. K. Sankaranarayanan, A. Antony Muthu Prabhu, N. Rajendiran, Inclusion complexation of 3, 5-dihydroxy benzoic acid with β-CD at different pH. Indian J. Chemistry, 48A (2009)1515-1521. |
| [18] | R. K. Sankaranarayanan, A. Antony Muthu Prabhu, N. Rajendiran, A Study on the inclusion complexation of 3, 4, 5-trihydroxybenzoic acid with β-CD at different pH. J. Inclusion Phenomena and Macrocyclic Chemistry, 67(2010)461-470,
https://doi.org/10.1007/s10847-010-9769-3 |
| [19] | T. Stalin, P. Vasantharani, B. Shanthi, A. Sekar, N. Rajendiran, Inclusion complex of 1, 2, 3-trihydroxybenzene with α- and β-cyclodextrins. Indian J Chemistry, 45A (2006) 1113-1120. |
| [20] | A. Antony Muthu Prabhu, V. K. Subramanian, N. Rajendiran, Excimer formation in inclusion complexes of β-CD with salbutamol, sotalol and atenolol: Spectral and molecular modeling studies, Spectrochimica Acta, 96A (2012) 95-107.
https://doi.org/10.1016/j.saa.2012.06.005 |
| [21] | M. Jude Jenita, G. Venkatesh, V. K. Subramanian, N. Rajendiran, Excimer formation in inclusion complexes of antihypertensive drugs with HP-α- and HP-β-CDs, Indian J. Chemistry, 52A (2013) 207-216. |
| [22] | J. Prema Kumari, A. Antony Muthu Prabhu, G. Venkatesh, V. K. Subramanian, N. Rajendiran, Spectral characteristics of sulfadiazine, sulfisomidine: Effect of solvents, pH and β-CD. Physics and Chemistry of Liquids, 49(2011)108-132.
https://doi.org/10.1080/00319104.2010.527399 |
| [23] | N. Rajendiran, R. K. Sankaranarayanan, J. Saravanan, A study of supramolecular host-guest interaction of dothiepin and doxepin drugs with cyclodextrin macrocycles. J Molecular Structure, 1067(2014) 252-260. https://doi.org/10.1016/j.molstruc.2014.04.033 |
| [24] | A. Antony Muthu Prabhu, N. Rajendiran, Encapsulation of labetalol, and pseudoephedrine in β-CD cavity: Spectral and molecular modeling studies. J. Fluorescence, 22(2012)1461-1474. https://doi.org/10.1007/s10895-012-1100-2 |
| [25] | M. Jude Jenita, G. Venkatesh, V. K. Subramanian, N. Rajendiran, Twisted Intramolecular Charge Transfer effects on fast violet B and fast blue RR: Effect of HP-α-CD and HP-β-CDs. J. Molecular Liquids, 178 (2013) 160-167.
https://doi.org/10.1016/j.molliq.2012.11.033 |
| [26] | N. Rajendiran, M. Swaminathan, Photophysical behaviour of 4, 4-dihydroxydiphenyl sulphone Indian J. Chemistry, 35A (1996) 385-389. http://nopr.niscpr.res.in/handle/123456789/41347 |
| [27] | N. Rajendiran, R. K. Sankaranarayanan, J. Saravanan, Nanochain and vesicles formed by inclusion complexation of 4, 4’-diamino benzanilide with Cyclodextrins. J. Experimental Nanoscience, 10(2015)880-899.
https://doi.org/10.1080/17458080.2014.930523 |
| [28] | N. Rajendiran, R. K. Sankaranarayanan, J. Saravanan, Nanostructures formed by cyclodextrin covered amino benzophenones through supramolecular self assembly, Spectrochim Acta, 127A (2014) 52-60.
https://doi.org/10.1016/j.saa.2014.02.024 |
| [29] | G. Venkatesh, J. Thulasidhasan, N. Rajendiran, A spectroscopic and molecular modeling studies of the inclusion complexes of orciprenaline and terbutaline drugs with native and modified cyclodextrins. J. Inclusion Phenomena and Macrocyclic Chemistry, 78(2014)225-237.
https://doi.org/10.1007/s10847-013-0291-4 |
| [30] | N. Rajendiran, G. Venkatesh, Inclusion complexation of 4, 4'-dihydroxy benzophenone and 4-hydroxy benzophenone with α- and β-CD. Supramolecular Chemistry, 26(2014) 783-795.
https://doi.org/10.1080/10610278.2013.873125 |
[17-30]
.
3.2. Intramolecular Proton Transfer Emission (IPT)
At pH ~7, 2AP exhibits a single broad emission in solvents but dual emission in both α-CD and β-CD. The dual emission, which is characteristic of IPT is clearly observed. Compared to pH ~3, the IPT emission is stronger at pH ~7 and pH ~11. This behavior may be attributed to variations in polarity, viscosity, and CD cavity size, which play a significant role in influencing the IPT behavior of 2AP. To confirm the dual emission of 2AP in the presence of CDs, solvent-induced changes in the absorption and emission spectra were also studied for this molecule in selected solvents. Both short-wavelength (SW) and long-wavelength (LW) emission intensities increased with increasing CD concentration and pH
| [15] | T. H. Kim, D. W. Cho, M. Yoon, D. Kim, Observation of hydrogen-bonding effects on twisted intramolecular charge transfer of p-(N, N-diethylamino) benzoic acid in aqueous cyclodextrin solutions, J. Phys. Chem. 100 (1996) 15670-15677.
https://doi.org/10.1021/jp960676h |
| [16] | Y. B. Jiang, Effect of cyclodextrin inclusion complex-formation on the twisted intramolecular charge-transfer (TICT) of the included compound: the p-dimethylaminobenzoic acid-β-cyclodextrin system, J. Photochem. Photobiol. A: Chem. 88 (1995) 109-116. https://doi.org/10.1016/1010-6030(94)04108-M |
| [17] | R. K. Sankaranarayanan, A. Antony Muthu Prabhu, N. Rajendiran, Inclusion complexation of 3, 5-dihydroxy benzoic acid with β-CD at different pH. Indian J. Chemistry, 48A (2009)1515-1521. |
| [18] | R. K. Sankaranarayanan, A. Antony Muthu Prabhu, N. Rajendiran, A Study on the inclusion complexation of 3, 4, 5-trihydroxybenzoic acid with β-CD at different pH. J. Inclusion Phenomena and Macrocyclic Chemistry, 67(2010)461-470,
https://doi.org/10.1007/s10847-010-9769-3 |
| [19] | T. Stalin, P. Vasantharani, B. Shanthi, A. Sekar, N. Rajendiran, Inclusion complex of 1, 2, 3-trihydroxybenzene with α- and β-cyclodextrins. Indian J Chemistry, 45A (2006) 1113-1120. |
| [20] | A. Antony Muthu Prabhu, V. K. Subramanian, N. Rajendiran, Excimer formation in inclusion complexes of β-CD with salbutamol, sotalol and atenolol: Spectral and molecular modeling studies, Spectrochimica Acta, 96A (2012) 95-107.
https://doi.org/10.1016/j.saa.2012.06.005 |
| [21] | M. Jude Jenita, G. Venkatesh, V. K. Subramanian, N. Rajendiran, Excimer formation in inclusion complexes of antihypertensive drugs with HP-α- and HP-β-CDs, Indian J. Chemistry, 52A (2013) 207-216. |
[15-21]
. The emission intensities of both SW and LW bands also increased with excitation wavelength (λ
exci ~260-300 nm). These results suggest the presence of IPT in the 2AP molecule, similar to that observed in aminobenzoic acid and hydroxy derivatives
| [17] | R. K. Sankaranarayanan, A. Antony Muthu Prabhu, N. Rajendiran, Inclusion complexation of 3, 5-dihydroxy benzoic acid with β-CD at different pH. Indian J. Chemistry, 48A (2009)1515-1521. |
| [18] | R. K. Sankaranarayanan, A. Antony Muthu Prabhu, N. Rajendiran, A Study on the inclusion complexation of 3, 4, 5-trihydroxybenzoic acid with β-CD at different pH. J. Inclusion Phenomena and Macrocyclic Chemistry, 67(2010)461-470,
https://doi.org/10.1007/s10847-010-9769-3 |
| [19] | T. Stalin, P. Vasantharani, B. Shanthi, A. Sekar, N. Rajendiran, Inclusion complex of 1, 2, 3-trihydroxybenzene with α- and β-cyclodextrins. Indian J Chemistry, 45A (2006) 1113-1120. |
| [20] | A. Antony Muthu Prabhu, V. K. Subramanian, N. Rajendiran, Excimer formation in inclusion complexes of β-CD with salbutamol, sotalol and atenolol: Spectral and molecular modeling studies, Spectrochimica Acta, 96A (2012) 95-107.
https://doi.org/10.1016/j.saa.2012.06.005 |
| [21] | M. Jude Jenita, G. Venkatesh, V. K. Subramanian, N. Rajendiran, Excimer formation in inclusion complexes of antihypertensive drugs with HP-α- and HP-β-CDs, Indian J. Chemistry, 52A (2013) 207-216. |
[17-21]
. The appearance of the LW emission at higher CD concentrations clearly indicates the presence of IPT emission in the 2AP molecule.
A question may arise as to why the 2AP molecule exhibits different IPT emission intensities at pH ~3, pH ~7, and pH ~11? It is well known that the strength of interaction depends on the polarity, CD cavity size, and guest molecular size in the inclusion complex. This implies that the interaction is highly sensitive to the relative sizes of the guest and the CD. The interaction between the amino/hydroxy group and the phenyl ring with the CD cavity plays an important role, as these polar groups can have maximum contact with the internal surface of the CD cavity. Further, the increased absorbance in CD solutions suggests that the aromatic ring is encapsulated within the non-polar region of the CD cavity.
At pH ~3 and pH ~11, protonation and deprotonation occur at the amino and hydroxy groups, respectively, leading to variations in the orientation of the 2AP molecule inside the CD cavity. Since the interior of the CD cavity is nonpolar, the neutral amino/hydroxy groups may penetrate more deeply into the cavity compared to their protonated (NH₃⁺) or deprotonated (hydroxyl anion) forms. Additionally, the amino group and the hydroxyl anion may interact with the CD - hydroxyl groups. Inside the CD cavity, the guest molecule experiences a much less polar environment, which enhances the IPT band. The geometrical constraint imposed by the α-CD cavity restricts the free rotation of the amino or hydroxy group, hindering IPT-state formation and thereby enhancing normal emission
| [17] | R. K. Sankaranarayanan, A. Antony Muthu Prabhu, N. Rajendiran, Inclusion complexation of 3, 5-dihydroxy benzoic acid with β-CD at different pH. Indian J. Chemistry, 48A (2009)1515-1521. |
| [18] | R. K. Sankaranarayanan, A. Antony Muthu Prabhu, N. Rajendiran, A Study on the inclusion complexation of 3, 4, 5-trihydroxybenzoic acid with β-CD at different pH. J. Inclusion Phenomena and Macrocyclic Chemistry, 67(2010)461-470,
https://doi.org/10.1007/s10847-010-9769-3 |
| [19] | T. Stalin, P. Vasantharani, B. Shanthi, A. Sekar, N. Rajendiran, Inclusion complex of 1, 2, 3-trihydroxybenzene with α- and β-cyclodextrins. Indian J Chemistry, 45A (2006) 1113-1120. |
| [20] | A. Antony Muthu Prabhu, V. K. Subramanian, N. Rajendiran, Excimer formation in inclusion complexes of β-CD with salbutamol, sotalol and atenolol: Spectral and molecular modeling studies, Spectrochimica Acta, 96A (2012) 95-107.
https://doi.org/10.1016/j.saa.2012.06.005 |
| [21] | M. Jude Jenita, G. Venkatesh, V. K. Subramanian, N. Rajendiran, Excimer formation in inclusion complexes of antihypertensive drugs with HP-α- and HP-β-CDs, Indian J. Chemistry, 52A (2013) 207-216. |
| [22] | J. Prema Kumari, A. Antony Muthu Prabhu, G. Venkatesh, V. K. Subramanian, N. Rajendiran, Spectral characteristics of sulfadiazine, sulfisomidine: Effect of solvents, pH and β-CD. Physics and Chemistry of Liquids, 49(2011)108-132.
https://doi.org/10.1080/00319104.2010.527399 |
| [23] | N. Rajendiran, R. K. Sankaranarayanan, J. Saravanan, A study of supramolecular host-guest interaction of dothiepin and doxepin drugs with cyclodextrin macrocycles. J Molecular Structure, 1067(2014) 252-260. https://doi.org/10.1016/j.molstruc.2014.04.033 |
| [24] | A. Antony Muthu Prabhu, N. Rajendiran, Encapsulation of labetalol, and pseudoephedrine in β-CD cavity: Spectral and molecular modeling studies. J. Fluorescence, 22(2012)1461-1474. https://doi.org/10.1007/s10895-012-1100-2 |
| [25] | M. Jude Jenita, G. Venkatesh, V. K. Subramanian, N. Rajendiran, Twisted Intramolecular Charge Transfer effects on fast violet B and fast blue RR: Effect of HP-α-CD and HP-β-CDs. J. Molecular Liquids, 178 (2013) 160-167.
https://doi.org/10.1016/j.molliq.2012.11.033 |
| [26] | N. Rajendiran, M. Swaminathan, Photophysical behaviour of 4, 4-dihydroxydiphenyl sulphone Indian J. Chemistry, 35A (1996) 385-389. http://nopr.niscpr.res.in/handle/123456789/41347 |
| [27] | N. Rajendiran, R. K. Sankaranarayanan, J. Saravanan, Nanochain and vesicles formed by inclusion complexation of 4, 4’-diamino benzanilide with Cyclodextrins. J. Experimental Nanoscience, 10(2015)880-899.
https://doi.org/10.1080/17458080.2014.930523 |
| [28] | N. Rajendiran, R. K. Sankaranarayanan, J. Saravanan, Nanostructures formed by cyclodextrin covered amino benzophenones through supramolecular self assembly, Spectrochim Acta, 127A (2014) 52-60.
https://doi.org/10.1016/j.saa.2014.02.024 |
| [29] | G. Venkatesh, J. Thulasidhasan, N. Rajendiran, A spectroscopic and molecular modeling studies of the inclusion complexes of orciprenaline and terbutaline drugs with native and modified cyclodextrins. J. Inclusion Phenomena and Macrocyclic Chemistry, 78(2014)225-237.
https://doi.org/10.1007/s10847-013-0291-4 |
| [30] | N. Rajendiran, G. Venkatesh, Inclusion complexation of 4, 4'-dihydroxy benzophenone and 4-hydroxy benzophenone with α- and β-CD. Supramolecular Chemistry, 26(2014) 783-795.
https://doi.org/10.1080/10610278.2013.873125 |
[17-30]
.
3.3. Excited Singlet State Lifetimes
The fluorescence lifetimes of 2AP in aqueous and CD media were determined from decay curves and are listed in
Table 1. The lifetimes of the inclusion complexes were longer than that of free 2AP. The lifetime of 2AP increased in the following order: water < α-CD < β-CD. This trend indicates that the β-CD: 2AP complex is more stable than the α-CD: 2AP complex. The increase in lifetime with increasing CD concentration is attributed to the encapsulation of the molecule within the CD cavity. These results demonstrate the greater complexation ability of β-CD, indicating higher encapsulation efficiency.
3.4. Molecular Modelling
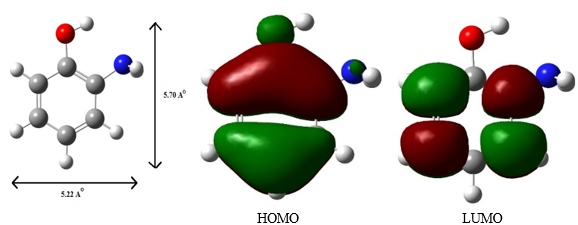
The ground-state geometries of 2AP, α-CD, β-CD, and their inclusion complexes were optimized using the PM3 method (
Figure 3). The HOMO-LUMO energies, thermodynamic parameters (energy, enthalpy, entropy, and free energy), dipole moments, zero-point vibrational energies, and Mulliken charge values are summarized in
Table 2. Both CDs have the same height (7.8 Å). The internal cavity diameter of α-CD is 4.7-5.3 Å, and that of β-CD is 6.0-6.5 Å; the external diameters are 8.8 Å and 10.8 Å, respectively.
In 2AP, the vertical and horizontal distances between the NH₂ and OH groups are 6.72 Å and 5.44 Å, respectively (
Figure 3). Both these dimensions are smaller than the β-CD cavity size, hence 2AP molecule freely entrapped in this CD cavity, however, the 2AP molecule is tightly encapsulate in the α-CD or 2AP molecule cannot be completely encapsulated within the α-CD cavity. These observations indicate that 2AP forms different types of inclusion complexes with α-CD and β-CD.
All thermodynamic parameters of the CD: 2AP complexes differ significantly from those of the isolated guest molecule, confirming complex formation. The negative values of energy, enthalpy, and Gibbs free energy indicate that the inclusion processes are both energetically and enthalpically favorable. The binding energies (ΔE) of the inclusion complexes are higher than that of the isolated 2AP molecule, suggesting enhanced stability of the complexes.
Table 2. Binding energies and HOMO, LUMO energy of 2-aminophenol (2AP) with α-CD and β-CD by PM6 method.
Properties | 2AP | α-CD | β-CD | 2AP-α-CD A | 2AP-α-CD B | 2AP-β-CD A | 2AP-β-CD B |
EHOMO (eV) | -8.93 | -10.05 | -9.99 | -8.93 | -9.20 | -8.55 | -8.91 |
ELUMO (eV) | 0.02 | 0.14 | 0.12 | 0.05 | -0.14 | 0.20 | 0.13 |
EHOMO - ELUMO (eV) | -8.95 | -10.19 | -10.11 | -8.99 | -9.05 | -8.76 | -9.04 |
µ (eV) | -4.45 | -4.95 | -4.93 | -4.44 | -4.67 | -4.17 | -4.39 |
χ (eV) | 4.45 | 4.95 | 4.93 | 4.44 | 4.67 | 4.17 | 4.39 |
η (eV) | 4.47 | 5.09 | 5.05 | 4.49 | 4.53 | 4.37 | 4.52 |
S (eV) | 2.23 | 2.54 | 2.52 | 2.24 | 2.26 | 2.18 | 2.26 |
ω (eV) | 4.43 | 4.81 | 4.81 | 4.39 | 4.81 | 3.97 | 4.26 |
Dipole (D) | 2.55 | 9.92 | 10.52 | 8.97 | 7.40 | 9.51 | 5.52 |
E* | -20.32 | -1353.95 | -1577.74 | -1387.13 | -1384.81 | -1609.83 | -1609.15 |
ΔE* | | | | -12.85 | -10.53 | -11.76 | -11.08 |
G* | 50.03 | 510.13 | 606.37 | 578.29 | 577.62 | 672.66 | 672.29 |
ΔG* | | | | 18.11 | 17.45 | 15.88 | 16.26 |
H* | 74.50 | 599.76 | 704.03 | 671.85 | 672.34 | 776.56 | 776.60 |
ΔH* | | | | -2.41 | -1.91 | -1.93 | -1.98 |
S** | 82.07 | 300.59 | 327.58 | 313.80 | 317.70 | 348.46 | 349.86 |
ΔS** | | | | -68.86 | -64.96 | -59.79 | -61.19 |
Figure 3. PM3 optimized structures of (a, b) 2AP (c, d) HOMO, LUMO of 2AP.
3.5. Nanomaterials Studies
3.5.1. Scanning Electron Microscope
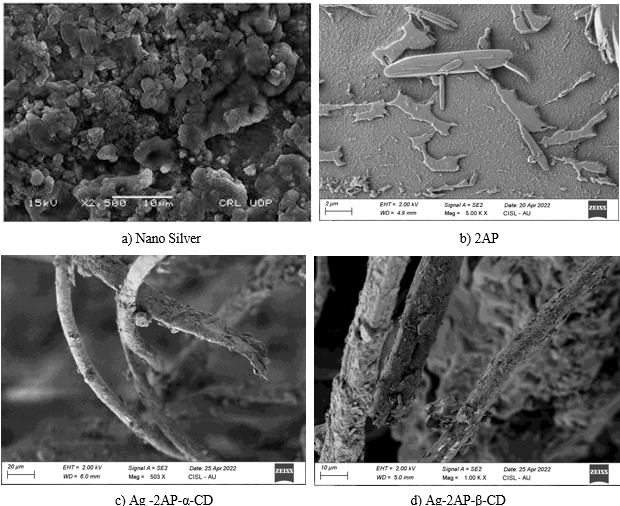
The copper nano, 2AP, Ag: 2AP: α-CD, and Ag: 2AP: β-CD nanomaterials were investigated by SEM (
Figure 4). The SEM images clearly show that Ag nanoparticles are present in a clustered spherical form, 2AP appears in a rod-like shape, Ag: 2AP: α-CD exhibits a micro-rod morphology, and Ag: 2AP: β-CD displays a rod-shaped structure. SEM-EDX data confirm the presence of approximately 5.5% silver nanoparticles in the nanomaterials. These morphological differences support the formation of the Ag: 2AP: CD nanomaterials.
Figure 4. SEM images for a) Ag nano, b) 2AP, c) Ag: 2AP: α-CD and d) Ag: 2AP: β-CD.
3.5.2. Infrared Spectral Studies
FTIR spectra was used to analyze Ag nano, 2AP, Ag: 2AP: α-CD, and Ag: 2AP: β-CD nanomaterials
| [40] | P Ramasamy, A Mani, B Sneha, E Nivetha, M Venkatesan, N Rajendiran, Azo-hydrazo tautomerism in Sudan Red-B and Cyclodextrin/ Sudan Red-B doped ZnO nanomaterials. J Molecular Structure 1329 (2025) 141423-32.
https://doi.org/10.1016/j.molstruc.2025.141423 |
| [41] | P. Ramasamy, A. Mani, B. Sneha, E. Nivetha, A. Antony Muthu Prabhu, G. Venkatesh, N. Rajendiran,* Synthesis and Characterisation of Sudan Red-G/Cyclodextrin doped ZnO Nanocrystals. American J Physical Chemistry 14 (2025) 23-32,
https://doi.org/10.11648/j.ajpc.20251402.12 |
| [42] | P. Ramasamy, A. Mani, B. Sneha, E. Nivetha, A. Antony Muthu Prabhu, G. Venkatesh, P. Senthilraja, N. Rajendiran*, Synthesis and Characterisation of Cyclodextrin /Methyl Violet doped ZnO Nanocrystals. Colloid and Surface Science 9 (2025) 19-30, https://doi.org/10.11648/j.css.20250701.12. |
| [43] | P. Ramasamy, A. Mani, B. Sneha, E. Nivetha, A. Antony Muthu Prabhu, G. Venkatesh, P. Senthilraja, N. Rajendiran*, Synthesis and Characterisation of Cyclodextrin/ Sudan Black-B Caped ZnO/ Nanocrystals. American J Quantum Chemistry and Molecular Spectroscopy 9 (2025) 1-11,
https://doi.org/10.11648/j.ajqcms.20250901.11 |
| [44] | P. Ramasamy, A. Mani, A. Antony Muthu Prabhu, G. Venkatesh, N. Rajendiran* Azo-Imino Tautomerism in Sudan Red 7B/Cyclodextrin Coated ZnO Nanocomposites: Evidence by Spectral and Microscopic Perspectives. Science Journal of Chemistry 13 (2025) 65 - 75,
https://doi.org/10.11648/j.sjc.20251303.13 |
| [45] | P. Ramasamy, A. Mani, A. Antony Muthu Prabhu, G. Venkatesh, P. Senthilraja, N. Rajendiran* PICT Effects and Anticancer Potential on Rosaniline and Spectral Characterisation of Rosaniline/Cyclodextrin Covered ZnO/ Nanocrystals. International J. Pure and Applied Chemistry 26 (2025) 107-121,
https://doi.org//10.9734/irjpac/2025/v26i3921 |
| [46] | P. Ramasamy, A. Mani, P. Senthilraja, N. Rajendiran Keto-Enol Tautomerism and Anticancer Potential on Sudan Blue II and Synthesis and Characterisation of Sudan Blue II/ Cyclodextrin doped ZnO Nanocrystals, J. Materials Science and Nanotechnology, 13 (2025) 1-16. |
| [47] | P. Ramasamy, A. Mani, P. Senthilraja, N. Rajendiran, Spectral, Microscopic and Anticancer Activity Investigation on Dimethyl Yellow/Cyclodextrin Doped ZnO Nanocomposites Journal of Chemical and Pharmaceutical Sciences (JCHPS) 18 (3) (2025) 33-43. |
| [48] | P. Ramasamy, A. Mani, P. Senthilraja, N. Rajendiran, Spectral Characteristics of ZnO/Mordent Yellow 12/ Cyclodextrin Nanomaterials, J Chemical Health Risks, (JCHR) 15(2025) 542-553, www.jchr.org |
| [49] | P. Ramasamy, A. Mani, P. Senthilraja, S. Senthilmurugan, N. Rajendiran, Spectral, Microscopic and Anticancer Activity of 1, 8-Diaminonaphthalene Doped ZnO Nanocrystals, VVIJOURNAL 14 (2026) 135-147, https://vvijournal.com/ |
[40-49]
. In the isolated 2AP molecule, the N-H, O-H, and C-H stretching frequencies appear at 3361, 3296, and 3043 cm
-1, respectively. The N-H bending and aromatic ring C=C stretching vibrations are observed at 1699, 1606, and 1509 cm
-1, respectively. The aromatic C-C, C-OH, and C-O stretching vibrations occur at 1468, 1304, and 1180 cm
-1, respectively. The C-O-C and C-N stretching bands appear at 1259, 1180, and 1360 cm
-1, respectively, while the O-H out-of-plane bending vibration is seen at 696 and 690 cm
-1 in the 2AP molecule.
In the nanomaterials, the NH₂ and OH stretching bands appear at 3230 and 2912 cm-1, respectively, while the aromatic C=C and C-O stretching vibrations are observed at 1608 and 1336 cm-1. The aromatic ring deformation band appears at 584 cm-1. A noticeable decrease in intensity in the spectra of nano Ag: 2AP: CD complexes suggests that the 2AP molecule strongly interacts with the silver nanoparticles.
3.5.3. Differential Scanning Colorimeter
The DSC profiles of α-CD, β-CD, 2AP and the corresponding inclusion complexes are also analysed. The DSC curves of α-CD shows three endothermic peak at 79.2 ºC, 109.1 ºC and 137.5°C and β-CD shows a broad endothermic peak at 128.6 ºC and, these endothermic peaks are attributed to crystal water loss from CDs. The melting and boiling point of 2AP shows a sharp peak at 120 and 164 ºC respectively. A broader endothermic effect was recorded for α-CD, β-CD and respective inclusion complexes as a consequence of water loss from the CDs. The DSC thermogram of Ag-2AP-CD complexes did not show peaks corresponding to pure 2AP and CD, instead new peaks appeared at 274 ºC and 291 ºC for Ag: 2AP: α-CD and Ag: 2AP: β-CD respectively.
3.5.4. X RD Spectral Studies
The crystallinity of all nanoparticles was determined from their XRD patterns
| [40] | P Ramasamy, A Mani, B Sneha, E Nivetha, M Venkatesan, N Rajendiran, Azo-hydrazo tautomerism in Sudan Red-B and Cyclodextrin/ Sudan Red-B doped ZnO nanomaterials. J Molecular Structure 1329 (2025) 141423-32.
https://doi.org/10.1016/j.molstruc.2025.141423 |
| [41] | P. Ramasamy, A. Mani, B. Sneha, E. Nivetha, A. Antony Muthu Prabhu, G. Venkatesh, N. Rajendiran,* Synthesis and Characterisation of Sudan Red-G/Cyclodextrin doped ZnO Nanocrystals. American J Physical Chemistry 14 (2025) 23-32,
https://doi.org/10.11648/j.ajpc.20251402.12 |
| [42] | P. Ramasamy, A. Mani, B. Sneha, E. Nivetha, A. Antony Muthu Prabhu, G. Venkatesh, P. Senthilraja, N. Rajendiran*, Synthesis and Characterisation of Cyclodextrin /Methyl Violet doped ZnO Nanocrystals. Colloid and Surface Science 9 (2025) 19-30, https://doi.org/10.11648/j.css.20250701.12. |
| [43] | P. Ramasamy, A. Mani, B. Sneha, E. Nivetha, A. Antony Muthu Prabhu, G. Venkatesh, P. Senthilraja, N. Rajendiran*, Synthesis and Characterisation of Cyclodextrin/ Sudan Black-B Caped ZnO/ Nanocrystals. American J Quantum Chemistry and Molecular Spectroscopy 9 (2025) 1-11,
https://doi.org/10.11648/j.ajqcms.20250901.11 |
| [44] | P. Ramasamy, A. Mani, A. Antony Muthu Prabhu, G. Venkatesh, N. Rajendiran* Azo-Imino Tautomerism in Sudan Red 7B/Cyclodextrin Coated ZnO Nanocomposites: Evidence by Spectral and Microscopic Perspectives. Science Journal of Chemistry 13 (2025) 65 - 75,
https://doi.org/10.11648/j.sjc.20251303.13 |
| [45] | P. Ramasamy, A. Mani, A. Antony Muthu Prabhu, G. Venkatesh, P. Senthilraja, N. Rajendiran* PICT Effects and Anticancer Potential on Rosaniline and Spectral Characterisation of Rosaniline/Cyclodextrin Covered ZnO/ Nanocrystals. International J. Pure and Applied Chemistry 26 (2025) 107-121,
https://doi.org//10.9734/irjpac/2025/v26i3921 |
| [46] | P. Ramasamy, A. Mani, P. Senthilraja, N. Rajendiran Keto-Enol Tautomerism and Anticancer Potential on Sudan Blue II and Synthesis and Characterisation of Sudan Blue II/ Cyclodextrin doped ZnO Nanocrystals, J. Materials Science and Nanotechnology, 13 (2025) 1-16. |
| [47] | P. Ramasamy, A. Mani, P. Senthilraja, N. Rajendiran, Spectral, Microscopic and Anticancer Activity Investigation on Dimethyl Yellow/Cyclodextrin Doped ZnO Nanocomposites Journal of Chemical and Pharmaceutical Sciences (JCHPS) 18 (3) (2025) 33-43. |
| [48] | P. Ramasamy, A. Mani, P. Senthilraja, N. Rajendiran, Spectral Characteristics of ZnO/Mordent Yellow 12/ Cyclodextrin Nanomaterials, J Chemical Health Risks, (JCHR) 15(2025) 542-553, www.jchr.org |
| [49] | P. Ramasamy, A. Mani, P. Senthilraja, S. Senthilmurugan, N. Rajendiran, Spectral, Microscopic and Anticancer Activity of 1, 8-Diaminonaphthalene Doped ZnO Nanocrystals, VVIJOURNAL 14 (2026) 135-147, https://vvijournal.com/ |
[40-49]
. Based on JCPDS data, the mineral name (3C) and face-centered cubic (FCC) structure were identified. The standard Ag FCC structure corresponds to JCPDS card number 87-0717, with hkl values at 111, 200, 220, and 311Pure Ag nano had strong powder peaks at 38.11º, 44.30º, 64.45º, and 77.40º. These peaks correspond to the reflection of the face centered cubic structure of metallic silver. The XRD pattern of α-CD shows a crystalline nature approximately at 11.94°, 14.11°, 21.77° and 𝛽-CD shows 11.49°, 17.58°, however, the intensity and presence of these can vary depending on the sample and preparation. 2AP shows orthorhombic system and the peaks appears at 7.253º, 7.833º, and 19.641º. The XRD pattern of Ag/2AP: β-CD nanomaterials shown that a clear distinct diffraction patterns at 12.13°, 19.26°, 27.25°, 31.76°, 37.63°, 45.86°, 65.04°, and 76.75°. The variation in the peak intensities of the nanomaterials and the pure components suggest that new nanomaterials are formed.